Rainfall and other forms of Precipitation


Effect of forest cover changes on sediment yield of Upper Indravati reservoir catchment - Orissa: A research report by National Institute of Hydrology
Posted on 21 Jun, 2010 02:08 AMThe study uses remote sensing data to develop a land use classification and applies statistical methods appropriate for Indian catchments to estimate the annual sediment load from the Upper Indravati catchment in Orissa for the year 2000. The study points to the fact that assessment of reservoir catchment regions at regular intervals would enhance the understanding of the geodynamic processes and help in identifying effective control measures.
Hydro-meteorological inventory of Orissa cyclones - A research report by National Institute of Hydrology
Posted on 21 Jun, 2010 01:38 AMThe study is based on investigations and collection of necessary information on the super cyclone in Orissa in October 1999. It examines cyclonic phenomenon in the country in general and Orissa in particular, and stresses the need for preparing a comprehensive plan for dealing with such disasters.
On variability of hydrological wet season, seasonal rainfall and rainwater potential of river basins in India (using rainfall data over 1813-2006) - An IITM technical paper
Posted on 10 May, 2010 09:12 PMThe paper discuses climatological and fluctuation features of important parameters of the Hydrological Wet Season (HWS), viz. starting and ending dates, duration, seasonal rainfall/rainwater and surplus rainfall/rainwater potential individually for the eleven major and thirty six minor river basins, the West Coast Drainage System (WCDS) and the rest of the country. It is based on reliable monthly rainfall data from a well spread network of three hundred and sixteen rain gauge stations from 1813 upto 2006.
The paper observes that the average period of the HWS is in close conformity with the southwest Monsoonal Rainy Season (MRS) over the basins in the Core Monsoon Rainfall Regime (CMRR). In the Mixed Monsoon Rainfall Regime (MMRR) covering south peninsula, northeast and extreme north, the HWS is of longer duration compared to the MRS due to extra-monsoonal rainfall over there. The mean starting date of the HWS is May 30, ending October 11 and the duration is 135 days for the entire country.
Water Footprint Manual: State of the art - A method of water footprint assessment by the Water Footprint Network (November 2009)
Posted on 11 Apr, 2010 07:37 PM The Water Footprint Manual (2009) by the Water Footprint Network (WFN) is a comprehensive and up-to-date outline of the method of water footprint assessment. It introduces how water footprints can be calculated for individual processes and products, as well as for consumers, nations and businesses.
The concept is introduced as a comprehensive indicator of freshwater resources appropriation, as against the traditional and restricted measure of water withdrawal. The hidden water use behind products are measured over the full supply chain and water consumption volumes are measured by source and polluted volumes by type of pollution. All components of a total water footprint are specified geographically and temporally. Blue water (surface and groundwater), green water (rainwater stored in the soil as soil moisture) and grey water (polluted water) footprints are defined and are included along with the indirect water use in measuring the overall water footprints.
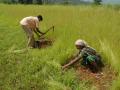
An ecological framework for water management in a domestic context - A spreadsheet-based toolkit by Biome
Posted on 08 Apr, 2010 10:43 PMBased on user-entered data on domestic water demand, waste water discharge, rainfall availability and recharge, extent of reuse of treated waste water, this spreadsheet-based toolkit developed by Biome Solutions allows you to juggle around with the relevant data fields, and figure out various ways in which you can bring down your overall groundwater draft (and hence ecological footprint) as low as possible, and gives a snapshot result of your overall household-level water input and output situation.
Using dried wells to enrich deep level under ground water pockets
Posted on 31 Mar, 2010 02:45 PMBy using dried open wells, we can enrich the Underground water quickly.
In the good old days, open wells used to help the common man in fetching water for all purposes and specially the drinking water. Invasion of pump-sets and specially the deep bore wells have pulled the underground water indiscriminately. Therefore, the water table level of the underground water is continuously going down at a very alarming rate. This fall in the underground water table level has made many a very big and useful water wells dry up. Now they are not in use as people do depend on alternative source of water like bore well water or the tap water drawn from far off river water.
The Himalayan glaciers controversy - An article in Ground Report India
Posted on 01 Mar, 2010 03:36 PMA huge controversy has been generated in recent days over the much quoted lines in the IPCC’s 2007 report: “Glaciers in the Himalaya are receding faster than in any part of the world and, if the present rate continues, the likelihood of them disappearing by the year 2035 and perhaps sooner is very high if the Earth keeps warming at the current rate” (Working Group 2, page 493). We do need to question how a statement of such magnitude, without peer review, made its way into the IPCC report. That it was discovered,externally, more than two years later raises concerns about both the mindset and the weakness of the processes of the IPCC in checking and correcting information they collate, information that is so vital in the global debate. However, to question the credibility of the science of the global warming, supported as it is by a wealth of empirical evidence, or to question IPCC’s work, as is happening in some quarters, is gross exaggeration and sometimes driven by dubious and malafide intentions.
Station-wise daily rainfall data for all districts of Rajasthan from 1973-2008
Posted on 11 Feb, 2010 05:32 PM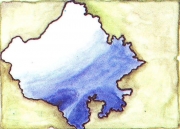 The Water Resources Department of the Government of Rajasthan, has made available, station-level, daily rainfall data from 1973-2008, for all districts of Rajasthan, on its website.
In order to make this data of better value to end-users, the India Water Portal has extracted and made this data available in a district-wise spreadsheet format, which you can download with a single click.
While extracting the data, we observed some discrepancies in the master data on the website. These notes can be viewed here.
Findings of Basin Focal Project on the Indo-Gangetic basin
Posted on 02 Dec, 2009 02:34 PMNo! This title isn't mine. I borrowed it from Mahmoud Darwish's literary work of the same name.
Why India needs to link rainfall to climate change
Posted on 23 Oct, 2009 07:24 AMClimate Change has already arrived in India. The recent flooding in Andhra Pradesh and Karnataka is portentuous of the times to come. As climate change accelerates, so will the unpredictability and intensity of the rainfall, giving rise to s