Past studies have found associations between land and poverty, however these studies are usually focused on small areas using ground based studies. This research explored and quantified associations between socioeconomic conditions derived from national census data and environmental metrics derived from remotely sensed imagery from Earth observation satellites on an extensive spatial scale, covering over 14000 villages in Assam in north-east India.
If non-causal associations can be found between census-based socioeconomic variables and remotely sensed environmental metrics it may be possible to use remotely sensed imagery as a limited, but valuable source of information regarding socioeconomic conditions of rural communities. The increased temporal resolution that remotely sensed imagery offers over the traditional ground survey methods used to obtain socioeconomic data may, in the future, increase the relevance and understanding of information available to policy makers for monitoring socioeconomic conditions.
One of the first jobs the author had to perform was to select the satellite imagery that would be used to identify environmental factors. Landsat ETM+ data was selected for use in the study as it was free to download, easily available on the internet and the image resolution was such that only six images were required to cover the whole study area.
As is often the case for satellite imagery, cloud cover presented problems due to the monsoonal weather patterns. It is difficult to remove semi-transparent clouds such as cirrus from Landsat data. Therefore, an applied method was developed to identify and remove semi-transparent cloud from Landsat imagery. The method was an adaptation of the the automated cloud cover assessment (ACCA) algorithm and has been published in the International Journal of Applied Earth Observation and Geoinformation.
The author spent six weeks in Assam visiting rural communities to explore the associations between socioeconomic conditions and local environmental factors. The main aims of the field work were to:
- Understand potential associations between people and land in rural areas of Assam;
- Identify land cover types that can be identified in satellite sensor imagery and that may have non-causal links with socioeconomic conditions.
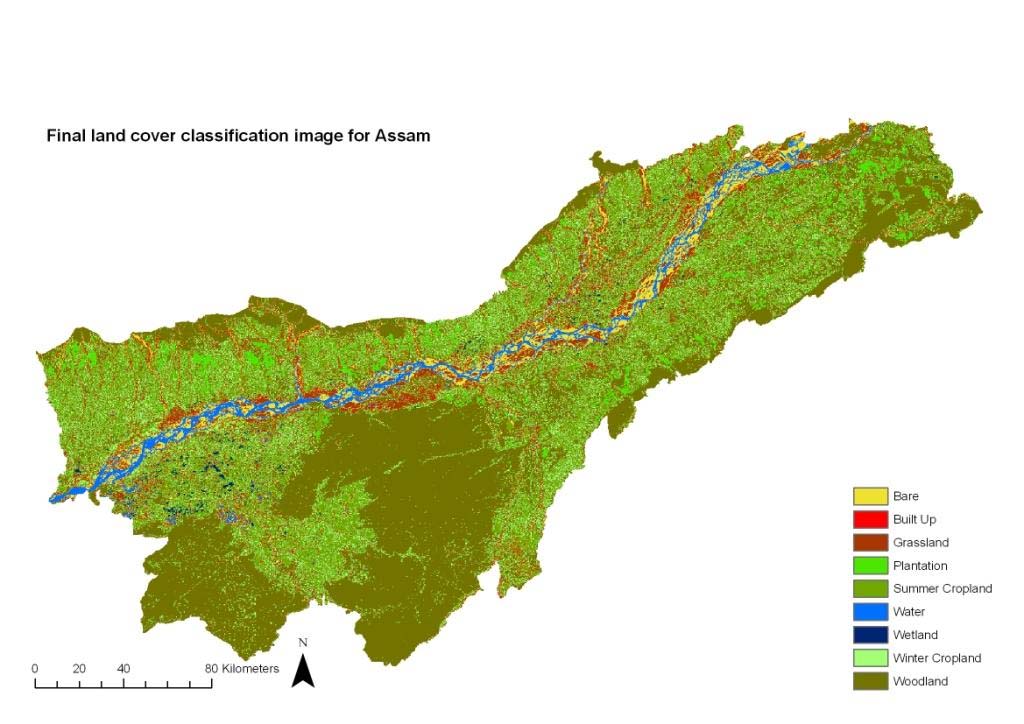
The majority of environmental metrics for the analysis were generated through an object-based land cover classification of Landsat ETM+ data. Object-based land cover classification generated nine land cover types that were used in statistical modelling.
The Landsat ETM+ data looks quite unclear prior to land cover classification but after using the eCongition Professional 5.5 software nine land cover classes were identified resulting in a land cover classification.
Logistic regression was used as a first step to identify potential associations between socioeconomic variables and environmental metrics. Census variables used were female literacy and economic alternatives to agricultural work. Logistic regression results indicated several associations between the census variables and environmental data acquired from earth observation. These results were often in agreement with the international development literature or field observations.
The results from the logistic regression were found to be affected by spatial autocorrelation. Spatial autocorrelation can result in models that have a greater significant fit to the data than is necessarily true. Therefore, a spatial logistic regression method was used to see the effect of spatial dependence on the model results. The results showed that the predicted range of female literacy was increased slightly using a spatial logistic regression.

Land cover classification created for Assam
It was created using Landsat 7 ETM+ data, and it has been atmospherically corrected using ATCOR 2. Further cloud removal was performed using the method developed in Watmough et al. (2011). Land cover classification was performed using eCognition Professional 5.5. Land under clouds was then replaced using the ‘Expand’ function in ESRI ArcMap 9.3.
Previous studies that integrated socioeconomic and remotely sensed environmental datasets used radial buffer zones to represent village boundaries and extract local environmental data. In Assam, no administrative boundary data were available at the village level and therefore radial buffer zones and Thiessen polygons were compared to see which provided the closest model fit (lowest AIC). Several fixed size buffer zones were developed along with buffer zones that were weighted according to the number of households and number of land owners within each village.
Overall results indicated that the buffer zone weighted according to the number of households in the village provided the best model fit (average buffer zone model). However, predictive accuracies of all village approximation methods were very similar indicating that the Thiessen polygons could provide an efficient estimate of the village boundary without the need for a priori information about the size of a village.
Download some of the chapters of the thesis here -
Introduction Chapter of the Thesis (32)
Literature Review Chapter of the Thesis (12)
Remote Sensing Chapter of the Thesis (21) [This chapter provides details of the land cover classification and the cloud removal process.]