The Ganges, the most revered river in India, faces an unusual predicament. Pollution and excessive usage have turned it into a toxic sludge as it snakes its way through cities, industrial hubs and millions of devotees.
It is also one of the world's most hyper-engineered landscapes and the water drawn from the river using millions of tube wells and canals is utilised not only for domestic use but for many other sectors like irrigation and industry, most of which are unregulated.

Dr Anthony Acciavatti, adjunct assistant professor, Graduate School of Architecture, Planning and Preservation, Columbia University has spent many years hiking, driving, and boating across the Ganga to map it and to understand the growing conflicts over its waters.
He has conducted the first systematic study and comprehensive mapping of the infrastructural transformation of the Ganga river basin and has published his findings in a book, Ganges Water Machine: Designing New India’s Ancient River.
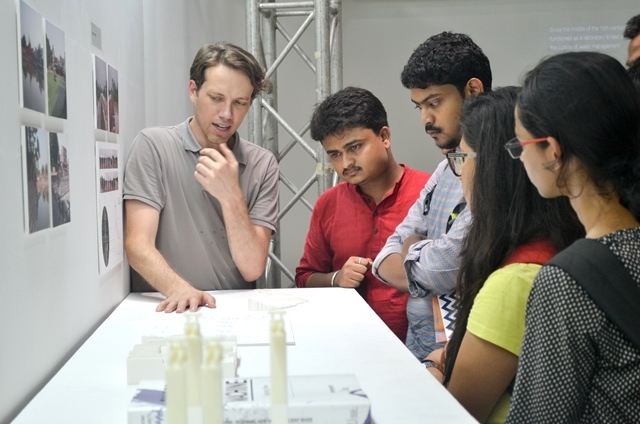
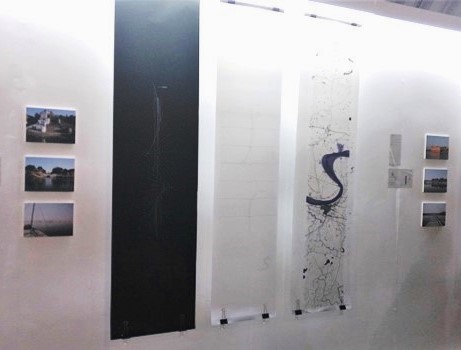
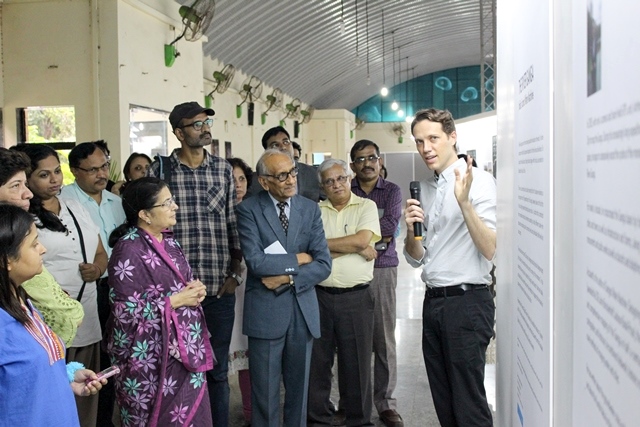
Columbia Global Centers, Mumbai had recently organised an exhibition The River Ganga: India's Iconic Water Machine and a host of public programmes from August 18-27, based on the work of Dr Acciavatti.
Dr Acciavatti spoke to India Water Portal about his study.
What triggered your interest in rivers? Why the Ganga?
I became interested in the Ganga for reasons that are at once biographical as well as professional. I grew up not too far from the mighty Mississippi River, lived for some time in New Orleans. I’ve also lived a few blocks away from the Tiber River in Rome, Italy. It was from these experiences that I developed a romance with rivers. It is that romance that brought me to study the Ganga.
In 2004, I finished my undergraduate studies and I knew I wanted to devote myself to the study of a major river system. Along with considering the Ganga, I also looked at the Amazon and the Nile rivers. However, what little information I could get about the Ganga intrigued me: it is one of the world’s most densely populated river basins, agriculturally productive, and undergoes radical changes every year with the arrival of the southwest monsoon.
In the days before Google Earth was launched, I scoured archives throughout the U.S. to see if I could find any contemporary maps of the basin. I wanted to better understand how people lived in this region and how they incorporated the dynamism of the monsoons into their daily lives. Much to my surprise, I could not find any maps. The paucity of maps only fueled my curiosity and led me to apply for a Fulbright Fellowship to India.
My proposal was straightforward: Because of the human density, the development of infrastructure, and the uncertainty of the monsoons, words and numbers fail to capture the dynamism of this landscape. So I asked the Fulbright committee to give me one year to construct what I called a dynamic atlas of the Ganga River basin—a hybrid between an almanac and atlas or a method of visualising the choreography of water and soils in their many states. I received the fellowship. I thought it would take me one year to do this work. Instead, it took a decade.
What was the focus of your study? How did it evolve as you progressed with your work?
This is a great question. The original focus of my work was to develop a dynamic atlas of the area between Allahabad and Varanasi in Uttar Pradesh. Once I began to explore this area by foot and by boat, three things became immediately clear to me: first, just following the path of the Ganga and studying the towns and cities along its edges were not enough. To better understand the rhythms of the monsoons, I needed to look at the larger basin and watershed as a whole.
Second, the connections between the monsoons, the flow of the Ganga, and groundwater were all interrelated. Witnessing the ubiquity of tube wells and pumping stations along the Ganga only reinforced these connections.
Third, it was an impossible task to map and visualise the basin in its entirety. Instead, I drew large swaths [sic]—known as transects—perpendicular to the Ganga, which allowed me to study portions of the basin in greater detail as well as compare and contrast these areas with one another. In short, the dearth of maps and the low resolution of Google Earth at the time forced me to be selective about what I studied within the Ganga basin.

Why did you feel the need to make connections between science and art in your work?
For some decades now, there has been a lot of cross-fertilisation between the arts and the science, particularly in terms of visualising change and environmental uncertainty. Because I am trained in art and architecture as well as in cartography and the history of science and technology, I drew upon these different disciplines to experiment with how to represent and visualise the larger Ganga basin. One of the ways I did this was by designing and making my own instruments to map and visualise the movement of sediment across the basin. With no maps and little data provided for the government, I had to develop my own methods of data collection. Because over one billion tons of silt are shed from the Himalayas every year, visualising the choreography of soils and how they impact water flow and agriculture, as well as groundwater, are all critical to rendering a fuller picture of the basin. My training in art and architecture helped me to carefully design things while my training in field sciences helped me with different methods of data collection.
How did your understanding of the Ganga change as you delved deeper and interacted with people from different regions?
For me, the biggest change that came in my understanding was just how important the tube well had become as a technology throughout the region. I would constantly hear the humming of diesel-powered pumps in cities and towns as well as in agricultural fields across the basin. The fact that this technology is almost completely unregulated and yet provides water for drinking and irrigation as well as the industry was an important component of what I call “The Ganges Water Machine”.
The level of water infrastructure in the basin, from millions of tube wells to thousands of kilometers of canals, makes it the most hyper-engineered landscape on the planet. Meeting people, chatting with them, and studying how they use these different technologies only enriched my sense of how important water infrastructure has been to India’s agricultural yields and urban growth. And these experiences, coupled with data provided by the government and non-government organisations, foregrounded the political and economic stakes of water management.
How do people from different regions experience the Ganga and what are the problems they face in terms of water quality and availability that can impact their lives and livelihoods? How do they cope with it?
For some, the sanctity of the Ganga was paramount to not only how they spoke about the river but also to how they interacted with it. But for the vast majority of people I met, especially those not living along the banks of the Ganga, the river was not at the forefront of their minds.
Because many inhabitants within the basin depend on groundwater for drinking and agriculture, there was more discussion about the quality of groundwater from either hand pumps or tube wells and less about water quality in the Ganga.
What role has technology played in influencing or changing the ways in which the Ganga has been managed and used at the community and at the policy level? Has this been positive or detrimental? If detrimental, what could be the alternatives?
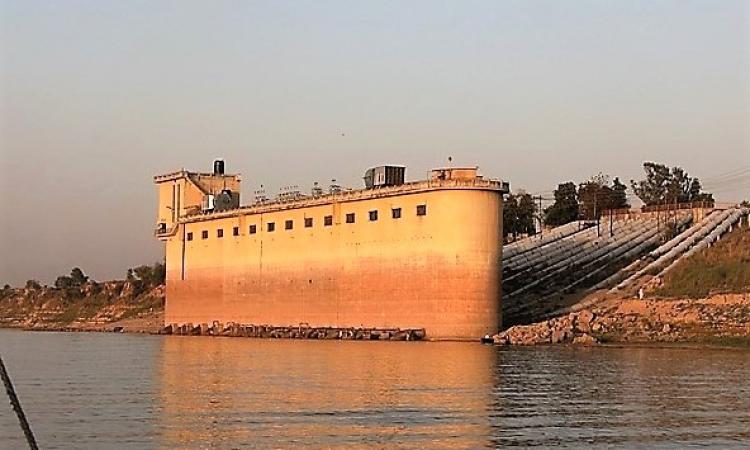
Since the middle of the 19th century, the Ganga basin has been a testing ground for developing new methods of water management. From the heroic scale projects of the Ganges canal system—one of the longest canal systems in the world—to the proliferation of millions of tube wells across India, the Ganga basin is shaped by infrastructure.
Whereas canal systems are highly centralised with incredible bureaucracies overseeing their management, tube wells are decentralised and a relatively unregulated economy. Even though canals generally divert water from rivers and tube wells extract water from the ground by means of electric or diesel-powered pumps, both systems are dependent on the precarity of the monsoons.
I look at how these technologies have been used and abused to shape everything from homes to cities and farms to regions. For example, while tube wells have been seen as a crucial technological input for the Green Revolution, they have also supported India’s urban growth, not just in megacities like Delhi, but also in towns and cities like Allahabad and Varanasi. Why? Because municipalities often cannot supply reliable and/or potable water, private citizens have sunk their own tube wells to sustain themselves (and even sell their groundwater). I wrote an op-ed about the Ganges' groundwater crisis for The New York Times, The Ganges water crisis.
What needs to be done to save the river and the future of the population dependent on it? In what way can your study influence policymaking or help communities to get involved with the Ganga?

One of the things that I focus on, not just in the book but also in the exhibition, is how important it is to visualise the river’s incredible dynamism for its life. One of the ways that I do this is by combining cartography and photography to show how spaces change over time. In the exhibitions, I do this through a series of animations and videos. For example, in one animation, I show the evolution of water infrastructure across the Ganga basin from the 19th century to the present.
Along with showing the extensions of canals and the proliferation of millions of tube wells across the landscape, I also project photographs of these infrastructures and how people use them in markedly different ways. These drawings and animations, which are what I refer to as a dynamic atlas, are not typical maps or drawings.
While most maps and drawings draw the world as a collection of static objects of buildings and roads, a dynamic atlas shows how spaces change over time. My dynamic atlas uses the rhythms of the monsoons as a giant water clock to better understand how people orient themselves to water in their daily lives. Without drawings that take into account these ecological changes, it is very difficult to understand how anyone can make policy recommendations in the region.
In collaboration with the Columbia Global Centers, Mumbai, we will be taking the exhibition to other cities throughout India. And the Center has organised a series of workshops with policymakers as well as a capacity building course on water/data visualisation.