Groundwater is water that is stored underground in aquifers or rock layers than can absorb water. India gets 85% of all its drinking water from this source.
Rainfall is an essential part of monitoring groundwater as it recharges the aquifer and brings groundwater levels up. Rainfall and well levels are important parameters for data collection.
Rainfall data from the IMD and well levels from the Central GroundWater Board (CGWB) from 2005 to 2009 were used in motion charts to understand the existing scenario.
Since the rainfall data was available only by district, the groundwater level data had to be aggregated to district view. If one actually is using data to monitor the groundwater situation, weather station-level data and well-level data is required to understand how the aquifer behaves. Since this wasn't available, motion charts were used to understand what the available data conveys.
What is a motion chart?
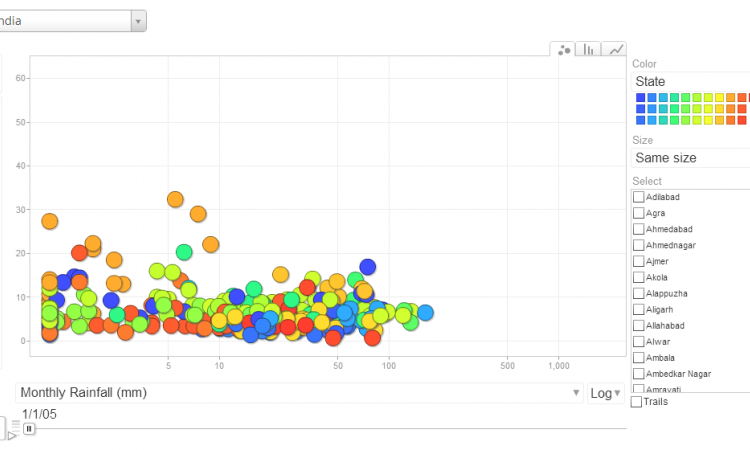
A motion chart allows one to view the data by time and by two parameters. In this, one can change the time, the x and y axis and the color scheme. One can pick a particular State and see the data for each district within the State.
For an explanation of the tool please refer the following presentation.
How can data be read using motion charts?
What is interesting about this visual is one can see how the well levels change with the rainfall over time. The most important area to look at is the upper right quadrant. If we can observe a data point (dot) is this quadrant, then it means that the well level is low (not a lot of water) but there is high rainfall. You can see this clearly for Gandhinagar district.
It has been reported to have problems raising groundwater levels. This means that the aquifer is not being recharged well by rainfall.
Click here to explore the tool better by accessing the various State pages.