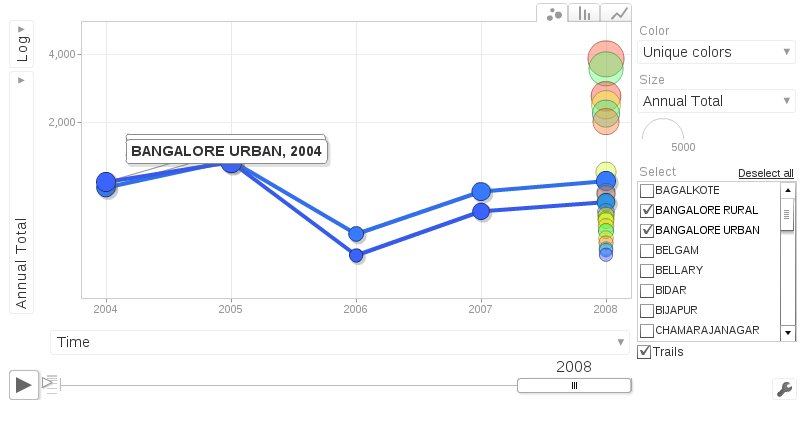
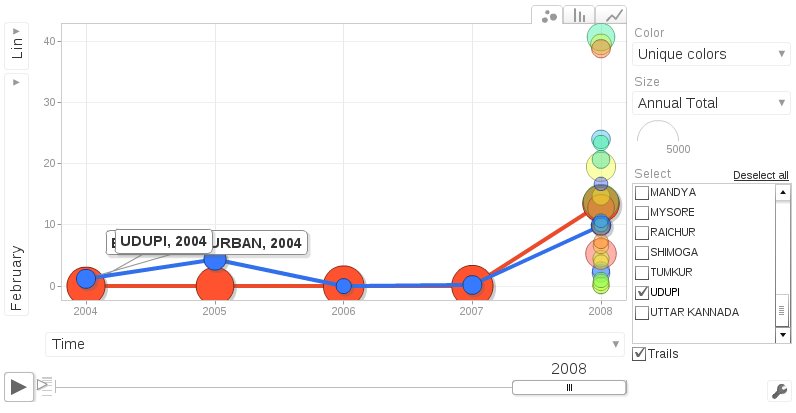
After watching “developing world” video on TED, I was eager to try out Google visualization API. When I found the rain fall information, I thought its the best suited data to play around. Go check out the Visualization of Rain Fall in Karnataka.

Data is from India water portal. Data is on public Google document. I have used Google Visualization API for this. Its easy and simple.

Post By: iwp