Groundwater is water that is stored below the ground in aquifers, or rock layers that can absorb water. India gets 85% of all its drinking water from this source. It is so important that there is a government agency called The Central Ground Water Board (CGWB) under the Ministry of Water Resources (MOWR), that is responsible for monitoring this precious resource.
They are in charge of measuring groundwater levels in wells all over the country; they also are taking up the huge exercise of detailed country-wide aquifer mapping. For Arghyam and India Water Portal groundwater is an important topic of discussion and looking at their data became a priority over the last year.
Groundwater data by Central Ground Water Board (CGWB)
The database from CGWB is publicly accessible and can be downloaded for analysis. Groundwater level details from 2005 to 2009 from all over the country is available on the Portal.
Groundwater data taken by the CGWB has been subject to criticism from many corners. Even the Planning Commission working group has written that there are some issues with their methodology.
“Estimates of groundwater potential and use are currently based mostly on data collected from 60000 to 70000 observation wells and piezometers. When compared with the estimates of wells numbering more than 20 Million (World Bank, 2009; Shah, 2009) this number is statistically insignificant to provide cognizable estimates.” - Planning Commission Working Group paper on Sustainable Groundwater Management.
In this context we thought it would be a worthwhile exercise to look at this data and see if there are any data inconsistencies.
Data for analysis
The CGWB maintains their well data grouped by districts and not by aquifer, and release reports based on this data at a district level. Hence the data was aggregated at the district level even though scientifically this isn’t the appropriate way to look at groundwater levels.
A recommendation would be to group wells by the aquifer that they are tapping and not by district once the aquifer mapping is completed. After these aquifer zones are created, political administration boundaries can be layered on to help understand the data better.
Understanding the data
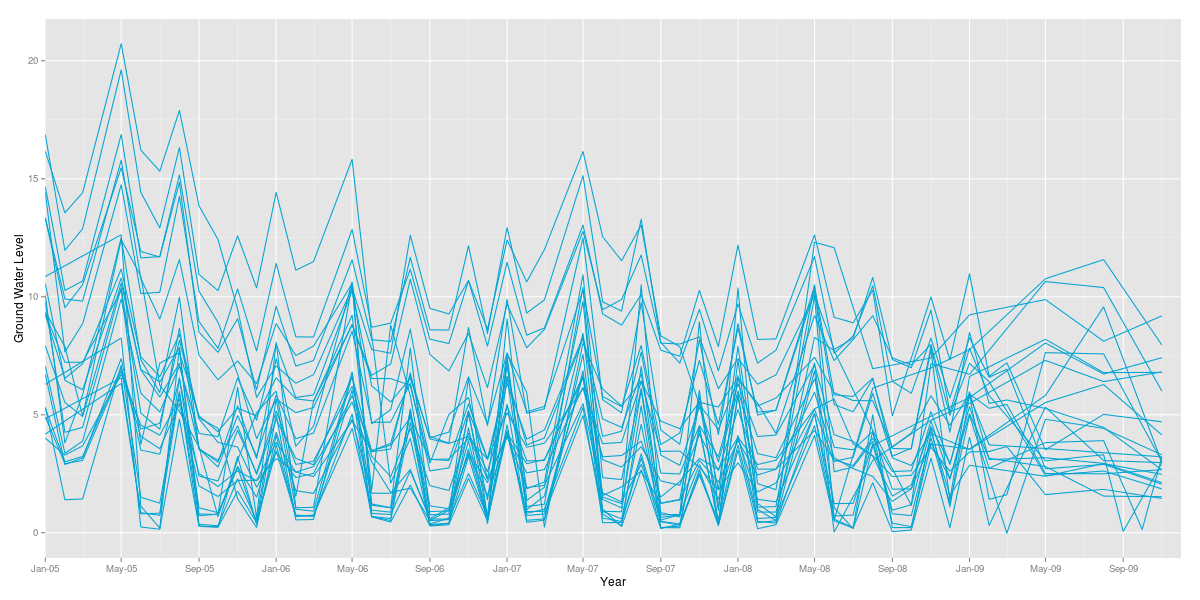
Since the monsoon season is fairly predictable, one could look at monthly level data. The basic pattern, which is higher levels in the monsoon months and lower levels in the summer months, should be seen with differences that can be attributed to rock types or use when they don’t always fit into that pattern.

The State of Andhra Pradesh shows this pattern. Every line in the graph depicts a district, with peaks being low well levels (not a lot of water in well) and low points being high well levels (lots of water).
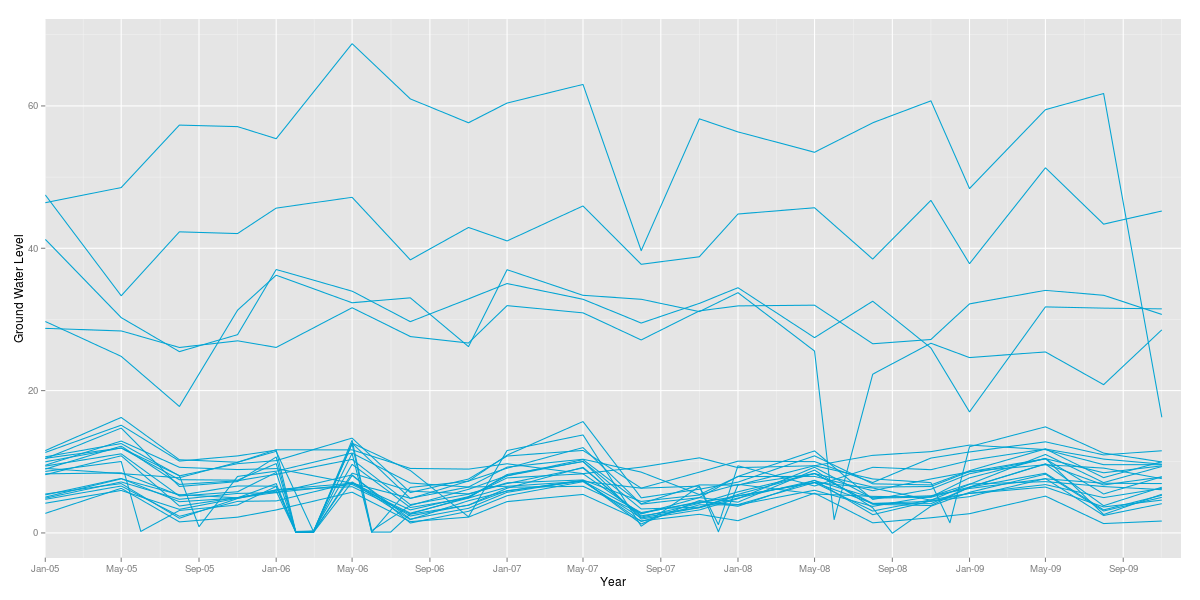
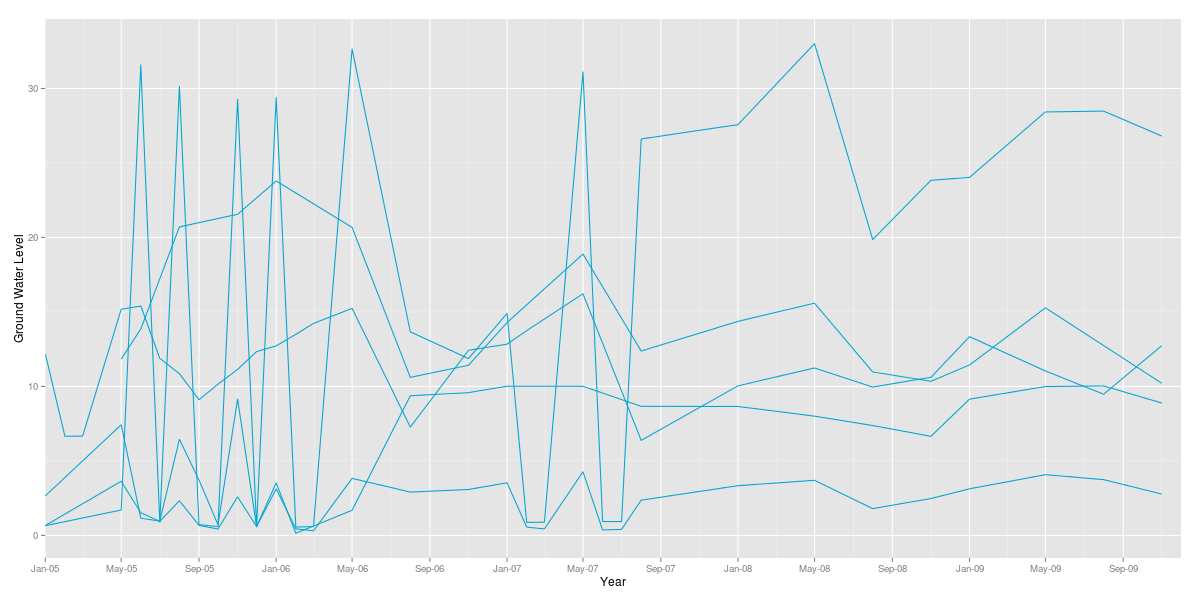
However, strangely not all states fall into this pattern. A look at Gujurat and Uttarakahand makes this very clear. They seem to have a completely different pattern and there are probably many reasons for it but it is interesting to see how different the data looks for each state.


While it is possible that these patterns are accurate representations of the groundwater status, it is difficult for people on the outside of CGWB to really understand why things look a certain way.
The CGWB does release these helpful district profiles, which describe in depth the groundwater situation in the area and the geological structure of the area. Data interpretation can be easier and more meaningful if the actual well data is linked to the geographic and geological areas as this would be helpful in understanding the behaviour of aquifers in specific areas.
Conclusion
While the efforts of CGWB in compiling and making the data available for public must bed appreciate, it is clear that there is a necessity to group this data better by giving it context and also present the data so that the general public can understand the existing scenario and also participate in monitoring this precious resource.
See more graphs based on these data sets and the methodology used to create them.