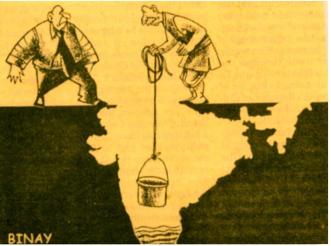
Credit: Binay, Business Standard
The Gravity Recovery and Climate Experiment of NASA has yielded a set of very insightful and alarming data on the ground water resources status in India. Ministry of Water Resources of India had been observing the hydrological balance since long and had indicated that the withdrawl rates are far too high than the natural replenishment, but the regional data was not available.
A NASA team analyzed six years of monthly GRACE gravity data for northern India to produce a time series of water storage changes beneath the region’s land surface.
The groundwater storage variation in northwestern India between 2002 and 2008, relative to the mean for the period, was animated by Trent Schindler and Matt Rodell.
The animation is available (9mb, mp4) here.
At WHSC, a lot of talks would be about the water resources of India, and for the benefit of effective conversations, I post the ground water observations of the GRACE satellites of NASA. The pictures are indeed a telling story about the state of affairs in the country. This also reinforces the need for such conferences debating and discussing policy, planning and management of water resources!
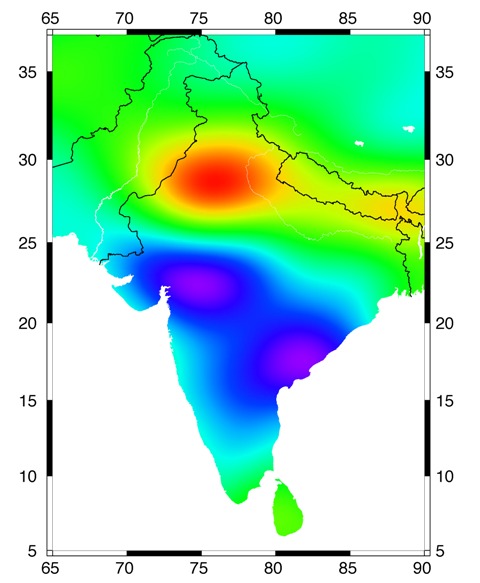
The map shows groundwater changes in India during 2002-08, with losses in red and gains in blue, based on GRACE satellite observations. The estimated rate of depletion of groundwater in northwestern India is 4.0 centimeters of water per year, equivalent to a water table decline of 33 centimeters per year. Increases in groundwater in southern India are due to recent above-average rainfall, whereas rain in northwestern India was close to normal during the study period. Credit: I. Velicogna/UC Irvine
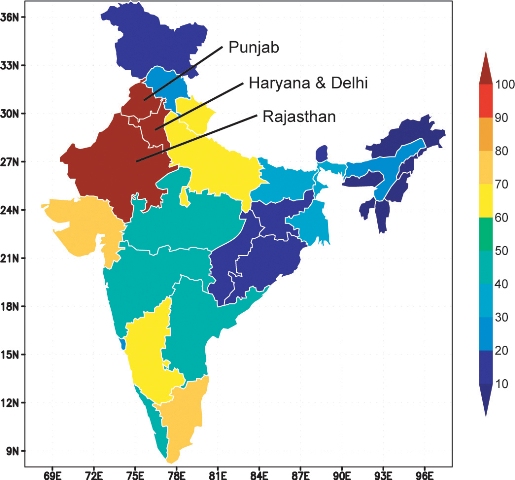
The map, showing groundwater withdrawals as a percentage of groundwater recharge, is based on state-level estimates of annual withdrawals and recharge reported by India's Ministry of Water Resources. The three states included in this study are labeled. Credit: NASA/Matt Rodell
International Water Management Institute (IWMI) too projects a similar picture, in these maps below. The following maps are from the report India's Water Economy: Bracing for a Turbulent Future by World Bank. I am posting this data here, so that the context and state of affairs is established before any conversations happen.
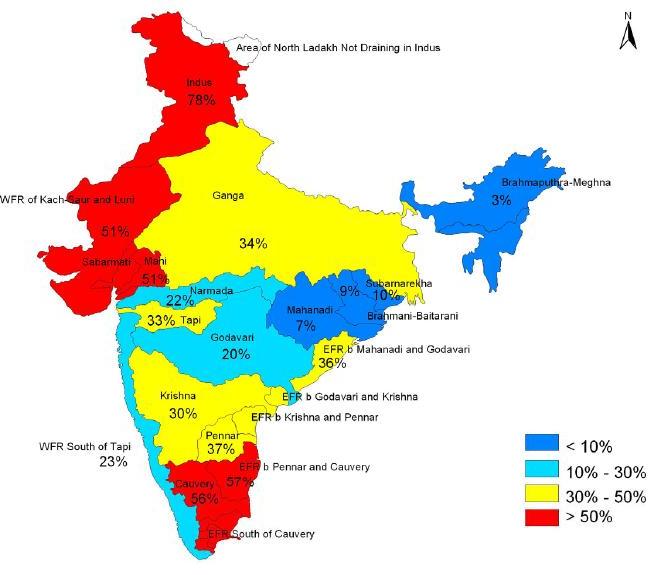
Credt: Tyagi, IWMI
The storage statistics, in terms of the number of days of average flow that can be stored in different river basins, India has a fraction of storage capacities in comparision to that of other countries with semi arid climate, and vast river systems like that of India.
The following map and bar chart illustrates this and shows how much water the indian infrastructutre fails to store!
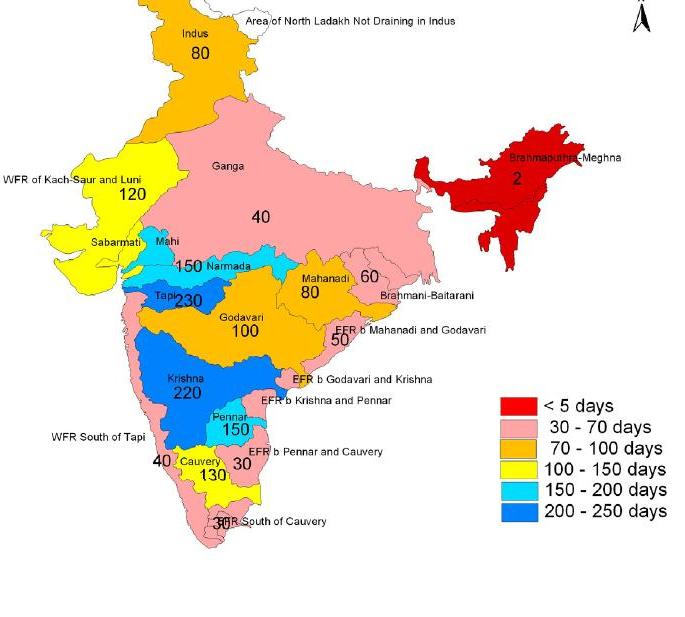
Credit: IWMI
Storage capacities of different river basins

Credit: India's Water Economy Report, World Bank