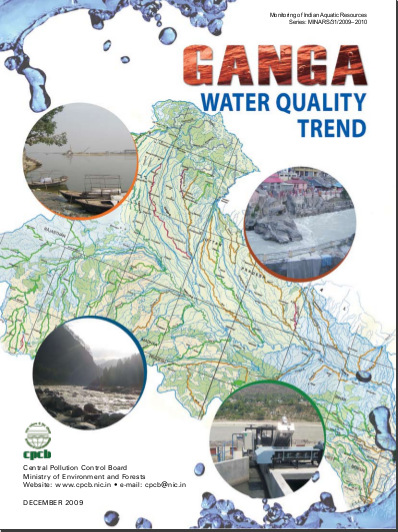
 The data has been collected over a period of many years from 39 water quality monitoring stations along the main river and 102 stations on its tributaries which were setup in 2008/09.
The study focuses on the parameters for dissolved oxygen, (DO), biochemical oxygen demand (BOD) and faecal coliforms (FC) as these indicate the biological health of the river. The period of study for the river Ganga is 1999-2008. The study finds that most of the water quality parameters studied do not meet the standards.
There are 13 chapters with many annexures. The annexures give details on the position of monitoring stations via maps, water quality trends at various monitoring stations using graphs and tables. The chapters are -
- Foreword
- Background
- Introduction
- Population status
- Water quality assessment studies
- Water quality trend
- Water quality assessment studies in Uttarakhand
- Water quality assessment studies in Uttar Pradesh
- Water quality assessment studies in Bihar
- Water quality assessment studies in West Bengal
- Overall water quality status of the river Ganga
- Status of river flow in Uttar Pradesh
- Conclusion
Population status
The Ganga basin is the largest river basin in the country and accounts for one-fourth of the geographical area of the country and is spread across 4 states. There are 33.78 crore people living in this river basin of which 6.78 crore live in urban areas. A table provides the population in various states in this river basin. The work of monitoring the water quality along the river is divided between the Central Pollution Control Board and the state pollution control boards through which the river passes. Besides site specific water quality monitoring, the parameters checked are temperature, pH, conductivity, dissolved oxygen (DO), biochemical oxygen demand (BOD), nitrate, nitrite, total coliforms (TC), and faecal coliforms (FC).
Water quality assessment studies in various states
Studies of the water quality parameters in each state and at various monitoring stations is presented and compared. For example the DO, BOD, and FC of the river in Uttarakhand meets the parameters as given in the EPA 1986. However, standards for FC conform in a few places only. It infact shows a decreasing trend in the major pilgrimage centres on this river. When the river passes through Uttar Pradesh BOD shows an increasing trend in most areas, while FC standards are met in only one location.
Water quality assessment of the river as it passes Bihar indicates that standards of BOD and DO are met at all testing locations. However, FC does not conform to the standards. When the river passes through West Bengal testing of water quality indicates that BOD and DO standards are met in most if not all locations. However, FC exceeds the standards at all monitoring locations. Tables, maps and graphs provide more information.
Overall water quality status of the river Ganga
The overall water quality status of the river is not very good. Except for Rishikesh and two other places FC does not meet the criteria in other locations. In certain stretches there is a lot of organic pollution. A table gives the classification of water at monitoring stations with respect to BOD.
Status of river flow in Uttar Pradesh
During the lean period the flow of the Ganga in Uttar Pradesh is less than 1000 m3/s. The flow of the river at various times of the year at various monitoring stations in Uttar Pradesh is provided via a graph. It is found that flow of the river in Kanpur during the lean period is almost half of that at Allahabad and Varanasi.
Status of waste water discharge into river Ganga
2561.7 million litres per day (MLD) of municipal waste water is discharged from Class I cities into the Ganga. However, there is only 45.8% capacity to treat this water ie only 1174.4 MLD waste water treatment capacity. The sewage generated in major cities on the Ganga like Patna, Varanasi, Kolkatta etc is much more than the treatment capacities present in these cities says the report.
Class II cities generate 121.9 MLD of waste water but they have a treatment capacity of 16.4 MLD, which is just 13.5% of total waste water generated. A table provides the quantity of industrial effluents generated and municipal waste discharged into the river.
The report makes an interesting observation that because of unabated discharge of treated sewage even after 100% treatment and with BOD level of 30 mg/l, it would not be possible to bring the river water to bathing quality level in lean periods of river flow.
Conclusion
In conclusion it is stated that there are two major problems facing the river - one is that almost 50% of untreated and/or partially treated sewage is dumped into the river and the second is that there is not much flow in the river during the lean periods. Further, river flow is low because of the Upper and Lower Ganga canals diversions.
The report notes that the problems besetting the river in each state is different. In Uttar Pradesh it is the need for treatment of sewage and minimum flow of river resulting in high BOD. But, in Bihar BOD meets standards but FC is high; and so on. Thus an assessment of flow and waste water is necessary to ensure a minimum flow is present in the river at all times. Therefore it is recommended that water storage facilities be created upstream of the Ganga riverine system which can be released in the lean period.